Table of Type of Pollutant &Concentration in ng/L at each Site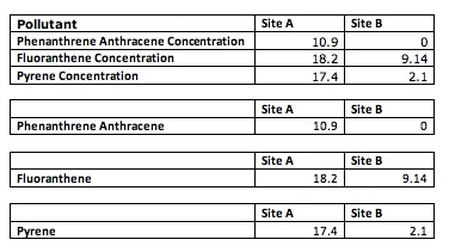
These are the types of pollutants and concentrations in nano-grams per liter at both Site A and B. These tables were used to create the graphs below. Site A is located at Lake Erie MetroPark. Site B is located at Lake St. Clair MetroPark. To see the locations of the sites, click here.
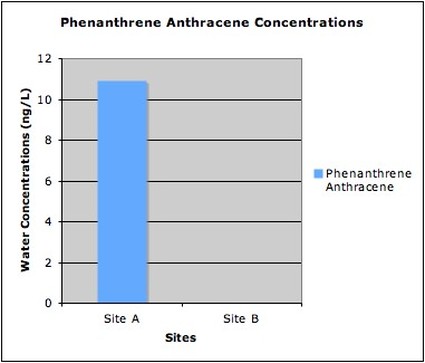
Phenanthrene Anthracene ConcentrationsAs you can see here, there is a higher concentration at Site A compared to Site B. Site A is located at Lake Erie MetroPark. Lake Erie MetroPark is located downriver from industrial Detroit. This result corresponds perfectly with what we expected. To see the locations of the sites, click here.
Comparing Both Sites and Pollutants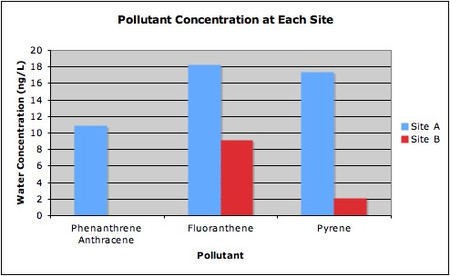
This graph is comparing both sites and each pollutant found. As hypothesized, Site A (Lake Erie) has more pollutants and a higher concentration of pollutants compared to Site B (Lake St. Clair). Lake Erie MetroPark is located down river from the industrial area of Detroit. To see the locations of the sites, click here
| Our Controls, Dependent&Independent VariablesControl: Blank EVA plate that is analyzed with each set of test plates, we also had multiple plates testing at each of the two sites for the same duration of time.
Dependent Variable: Concentration of pollutant, wind-carrying pollution from local factories, proximity to pollution sources (like factories, farm land, storm drain over flows etc…) Independent Variable: Location of the BIF/Body of Water Pyrene Concentrations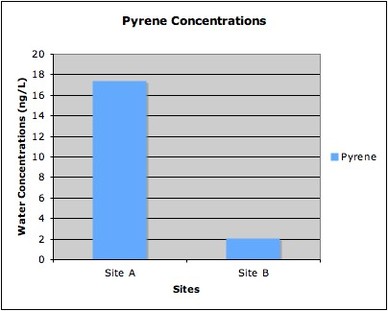
This graph shows the pyrene concentrations at Sites A and B. Again, notice how there is exponentially more pollution at Site A, versus Site B. Based on where Site A is located, the result corresponds well with what we hypothesized. To see the locations of the sites, click here.
Fluoranthene Concentrations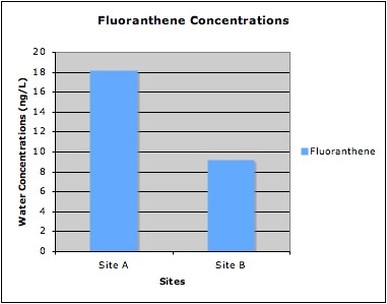
This graph shows the concentrations of Fluoranthene at both Sites A and B. Again, Site A shows a higher concentration of Fluoranthene compared to Site B. To see the locations of each site, click here.
To download our data, click here.
|
Analysis
Site A is located at Lake Erie MetroPark and Site B is located at Lake St. Clair MetroPark, which is located North of the industrial region of Detroit, Michigan (see location photos). Lake Erie is located downriver from the industrial region of Detroit, Michigan.
Looking at the data table of the pollutants and their concentrations at both Site A and B in the attached excel document, it is clear that Site A has higher concentrations of toxins than Site B. The concentrations shown in the data table are in nano-grams per liter.
Site A is impacted with Phenanthrene Anthracene, Fluoranthene, and Pyrene. The concentration of Phenanthrene Anthracene at Site A is 10.9 ng/L; the concentration of Fluoranthene at site A is 18.2 ng/L; and the concentration of Pyrene at Site A is 17.4 ng/L.
Site B is impacted with Fluoranthene and Pyrene; Phenanthrene Anthracene was not found at Site B at all. The concentrations of the pollutants found, however, were significantly lower than the concentrations found at Site A. The concentration of Fluoranthene is 9.14 ng/L; and the concentration of Pyrene found at Site B is 2.1 ng/L.
Looking at each of the graphs on the attached excel document, it is noticed that Site A is impacted by toxins more than at Site B. This definitely supports our hypothesis in that we expected to see more toxins and chemicals found at Site A since it is located downriver from the industrial center of Detroit. In addition to that, the Detroit River flows through the industrial center, allowing chemicals and toxins to enter Site A easily. We also expected to be able to determine the types of pollutants at each Site. Our data supports our hypothesis because we were able to not only determine the different pollutants, but also the concentrations of pollutants.
Discussion
The data that we collected and observed indicates that Site A is impacted more with pollutants when compared to Site B. Site A has higher concentrations of all three pollutants found, whereas site B has lower concentrations and only two pollutants found. The pollutants found at each site are: Phenanthrene Anthracene, Fluoranthene, and Pyrene.
According to the MSDS sheet for Phenanthrene Anthracene, it is hazardous in the case of skin contact, ingestion and inhalation. The LD50, or lethal dose, is 700mg/kg. LD50 means the lethal dose that can kill 50% of a population of a species. Scientists often use small species, such as larvae, and increase the concentrations of the pollutant until 50% of the population dies. This determines the LD50. For more information, see the MSDS sheet attached for phenanthrene.
The pollutant pyrene was also found at both Sites A and B. Site A had a much higher concentration of pyrene compared to Site B. Pyrene is also hazardous in case of eye contact, ingestion, and inhalation. In addition to that, pyrene can cause mutagenic effects for mammalian somatic cells. It is also mutagenic for bacteria and/or yeast. The ecotoxicity (LD50) in water is 1.8 mg/L. This was determined using a water flea. 1.8 mg/L converts to 1800000 ng/L. The concentration of pyrene found at Site A is 17.4 ng/L and at Site B it is 2.1 ng/L. Our data indicates that the pollutant found at both sites is nowhere near toxic levels. However, it is still high. For more information, see the MSDS sheet attached for pyrene.
The last pollutant found at both sites is Fluoranthene. Again, a higher concentration was found at Site A compared to Site B. It is hazardous in case of ingestion, skin and eye contact, and inhalation. The LD50 value is not available on the MSDS sheet found. However, if you would like more information, see the attached MSDS sheet.
All three of these pollutants are carcinogens, neurotoxins, and can cause birth defects. They are products of combustion, industrial activity, and are often found near smoke stacks. Since higher concentrations were found at Site A, this leads us to believe that the industrial center in Detroit has an impact on the Detroit River that flows down into Lake Erie, causing pollution.
To view the MSDS Sheets used click the links below.
Pyrene
Fluoranthene
Phenanthrene Anthracene
